Abstract
Environmetric techniques such as hierarchical cluster analysis (HCA), discriminant analysis (DA) and principal component analysis (PCA) methods are applied to investigate spatial variation and potential pollutant sources of surface water quality data of the Malacca River in Malaysia. HCA categorized three different cluster regions, namely Cluster 1 or LPS, Cluster 2 or MPS, and Cluster 3 or HPS. DA resulted in nine discriminant variables, namely turbidity, TSS, pH, BOD, COD, E. coli, As, Zn, and Fe. PCA indicated six components in HPS and MPS with total variance of 84.9% and 84.4%, while LPS result five components had a total variance of 77.1%. Generally, major sources of pollution are agricultural, residential and wastewater treatment plants, domestic and commercial waste, industry, as well as animal husbandry. The present study provides useful information for local authorities to identify sources of pollution of the examined area and effectively in proper management for land use area. Additionally, the study also helps in understanding river water quality within the basin and provides a database for future reference in developing water policies.
Keywords: water quality, HCA, DA, PCA, spatial variation
Citation of Article:
Hua, A. K. (2017). Analytical and detection sources of pollution based environmetric techniques in Malacca River, Malaysia. Applied Ecology and Environmental Research, 15(1), 485-499.
INTRODUCTION
Water resources have been depleting in recent year. According to worldwide statistics for water pollution developing countries produce 70% of industrial wastes that are dumped untreated into water and that an average of 99 million pounds (45 million kilograms) of fertilizer and chemicals are used each year (National Geographic Portal, 2016). This situation is no exceptional in Malacca River. Currently, the river has been reported to be contaminated and cause death to various fish species (Hua, 2015a, 2015b; Metro Online, 2015; Daneshmand et al., 2011; Nasbah, 2010). The state government has taken actions in terms of law enforcement (Hua, 2015a), policies for water resources (Hua, 2015b), exposure through religious and moral education (Ang, 2014), and public awareness about the importance of the environment (Hua and Marsuki, 2014), especially riverine water resources. However, the implementation of such projects to preserve river water quality by the state government still has not changed levels of water pollution to a lower level. The problem still persists even up to a higher level and has become more dangerous. Hence, the major pollutants from the main sources of pollution should be investigated and determined, especially in terms of spatial variation in the Malacca River.
Hierarchical cluster analysis (HCA), discriminant analysis (DA), and principal components analysis (PCA) are categories in environmetric methods that have been successfully applied in hydrochemistry especially in surface water, groundwater quality assessment, and environmental research (Mustapha et al., 2013; Najar and Khan, 2012; Samsudin et al., 2011). These methods have the ability to define all possible influences, including hidden information in an environmental water quality data set and offering greater possibilities in decision making process (Aris et al., 2013). Generally, HCA technique able to divides a large number of objects into a smaller number of homogenous groups on the basis of their correlation structure (Voyslavov et al., 2012), DA has the advantage of discriminating variables between two or more naturally occurring group (Singh et al., 2011), and PCA is used to extract important information from raw data, compress large size data by storing only important information, simplifying the description of data set, and analyzing the observations and variables together (Abdi and Williams, 2010). Therefore, this research study has been carried out to analyze the current condition of river water with quality based descriptive statistics, and to identify the main source of pollution using HCA, DA and PCA techniques in terms of spatial variation in the Malacca River.
METHODOLOGY
Description of Study Area
The Malacca River has a total catchment area of approximately 670 km2 . The river lies within latitudes 2°23’16.08”N to 2°24’52.27”N and longitudes 102°10’36.45”E to 102°29’17.68”E in Malaysia. Malacca River have 80 km in length and only 7 sub basins are selected in the study, namely the Kampung Kelamak sub-basin, Kampung Sungai Petai sub-basin, Kampung Panchor sub-basin, Kampung Harmoni Belimbing Dalam sub-basin, Kampung Tualang sub-basin, Kampung Cheng sub-basin, Kampung Batu Berendam sub-basin (Fig. 1). There is a reservoir located between Alor Gajah and Malacca Central districts along the river, namely Durian Tunggal Reservoir, which has a catchment approximately 20 km2 and acts as a source of water supply to Malacca residents.
The climate in the study area is characterized as uniformly average annual temperatures, high rainfall, and high humidity. These conditions impact on the hydrology and geomorphology of study area. The study area experiences two seasons, namely a dry season from January to March and a wet season from April to November. Normally, the weather consists of a South-West monsoon blowing across the Straits of Malacca, and the area easily experiences flooding. The selected study area can be categorized as impacted and non-impacted, which lie between Kampung Harmoni Belimbing Dalam sub basin to Kampung Batu Berendam sub basin with an area of 68 km2 and Kampung Kelemak sub basin to Kampung Panchor sub basin with an area of 12 km2 , respectively.
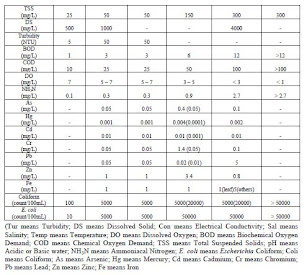
Water quality data in this study were obtained from Department of Environment (DOE), Ministry of Natural Resource and Environment of Malaysia, and are concentrated on 9 stations along the main Malacca River (Table 1). The availability data were recorded from January to December of 2014 for all 9 sampling sites representing 7 sub-basins as previously described across the Alor Gajah and Malacca Central Districts. Generally, the parameters of river water quality consist of physic-chemical parameters (i.e. pH, temperature; electrical conductivity (EC); salinity, turbidity, total suspended solids (TSS); dissolved solids (DS); dissolved oxygen (DO); biochemical oxygen demand (BOD); chemical oxygen demand (COD); ammoniacal-nitrogen(NH3N); trace elements (i.e. mercury (Hg), cadmium (Cd), chromium (Cr), arsenic (Ar), zinc (Zn), lead (Pb), and iron (Fe); and biological parameters (i.e. Escherichia coliform and total coliform). All samples are analyzed based APHA (2005) method.
Figure 1. 7 sub-basin with 9 sampling stations along Malacca River. The Data and Monitoring Site.
Water Quality Analysis and Data AnalysisThe river water quality data was analyzed using Statistical Package for Social Science version 19 (SPSS 19) for descriptive analysis and environmetric techniques based HCA, DA, and PCA. In HCA, Wards method through variance analysis was used to evaluate distance between clusters with minimal sum of squares (SS) for any two clusters formed at each step (Mustapha et al., 2013; Najar and Khan, 2012; Samsudin et al., 2011); follow by squared Euclidean distance used to measuring similarity between two samples and distance that can be represented by different between analytical values from the samples (Mustapha et al., 2013; Najar and Khan, 2012; Samsudin et al., 2011); and the results are provided through a dendrogram grouping the high similarity with small distances between cluster (Gazzaz et al., 2012). The present study employed HCA to investigate grouping of sampling sites (spatial). Meanwhile, DA determines variables through discriminate between two or more groups or cluster (Gazzaz et al., 2012; Samsudin et al., 2011), as expressed in the equation below:
where i is the number of groups (G), ki is the constant inherent to each groups, n is the number of parameters used to classify a set of data into a given group, and wij is the weight coefficient assigned by DF analysis (DFA) to a given parameter (Pij). The present study applied DA to determine that the means of the variables differ within groups and to predict the pattern. HCA results are applied into DA using standard stepwise, forward stepwise, and backward stepwise modes to develop the DFs in evaluating spatial variations of river water quality. Generally, dependent variables are the sampling stations (spatial), while independent variables are all other parameters involved. Next PCA, with the ability to provide information on most significant parameters due to spatial and temporal variations, defines the whole data set by excluding less significant parameters with minimum loss of original information (Singh et al., 2011), which is explained by the equation below:
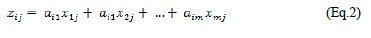
where z is the component score, a is the component loading, x is the measured value of the variable, I is the component number, j is the sample number, and m is the total number of variables. Normally PCA will undergo procedure like (1) for original data to be reduced to dominant components or factors (source of variation) that influence the observed data variation, and (2) whole data set will be extracted through eigenvalues and eigenvectors from the square matrix produced by multiplying data matrix (Aris et al., 2013). The main condition is that eigenvalues should more than 1 to be considered as significant (Juahir et al., 2011) to perform new group of variable namely Varimax Factor (VFs). Generally, VFs coefficients that have a coefficient of more than 0.75 are considered as ‘strong’, while 0.75 to 0.05 are moderate and 0.50 to 0.30 are weak (Juahir et al., 2011). The present study applied PCA to the normalized data set (20 variables) separately based on the different spatial regions obtained from the HCA technique.
RESULTS AND DISCUSSIONS
Descriptive analysis through mean and standard deviation for physico-chemical parameters, biological parameters and trace metal for year 2014 can be obtained from Table 2. Majority pH, temperature, and trace metal are in clean condition, except for iron in station 6 and station 9 that resulted in a class 3 ranking. Continuously, physical parameter showing salinity (in station 1 to station 3 and station 7), turbidity (in station 3, station 6 and station 8), electrical conductivity (in station 1 and station 6), dissolved solid (in station 1 and station 7), and total suspended solid (in station 6) resulted in class 5; while class 4 with total suspended solid and turbidity resulted in station 4, station 5, and station 9. Only electrical conductivity (in station 2 and station 3), turbidity (in station 1 and station 2), and dissolved solid (in station 2) are class 3; and other stations still remain clean (Table 3). Chemical parameter shows only biochemical oxygen demand and ammoniacal nitrogen are in class 5 and class 4, which is from station 1 to station 3 and station 6 to station 8. Meanwhile, mean analysis indicates biochemical oxygen demand (in station 4, station 5, and station 9), chemical oxygen demand (in station 1 to station 3 and station 7 to station 8), dissolved oxygen (in station 1 to station 3 and station 7), and ammoniacal nitrogen (in station 4) are in class 3, while the other stations remain class 2 and class 1. For biological parameters, majority total coliform is in class 5; and E. coli resulted in class 5 (in station 1 to station 2 and station 8), class 4 (station 3, station 6, station 7 and station 9) and class 3 (in station 4 and station 5).
Analysis of HCA is shown in Figure 2 for nine sampling stations along Malacca River, indicating that 3 clusters have been identified from the techniques. Cluster 1 consists of S1 (Kampung Kelemak sub-basin), S2 (Kampung Sungai Petai sub-basin), and S3 (Kampung Panchor sub-basin); cluster 2 consists of S4 (Kampung Harmoni Belimbing sub-basin), S5 (Kampung Tualang sub-basin), and S6 (Kampung Cheng sub-basin); and cluster 3 consists of S7 (Kampung Batu Berendam sub-basin), S8, and S9. Generally, cluster 1 is considered as low-pollution sources (LPS) because a majority of land area is used for agriculture, animal husbandry, and residential activities; while cluster 2 is considered as middle-pollution sources (MPS) due to the land used area is residential and industrial activities; and cluster 3 are high-pollution sources (HPS) due to the residential, sewage treatment plant, commercial, and industrial activities.
DA techniques are used to evaluate the possibility changes in land used based on the 3 cluster that resulted from HCA output. The results indicate that clusters in standard mode for 20 variables are 91%, forward stepwise mode for 5 variables are 79%, and backward stepwise mode for 9 variables are 87%. Therefore, backward stepwise mode is considered for further analysis, which have turbidity, total suspended solid, pH, biochemical oxygen demand, chemical oxygen demand, E. coli, arsenic, zinc and iron. A box and whisker plot of water quality parameter for 2014 are shown in Figure 3.
Figure 2. Hierarchical cluster analysis (HCA) through Ward Linkage method to generate dendogram
PCA was applied to the data set to compare the compositional patterns between the examined water parameters and to identify the factors that influence each of the identified regions (e.g. HPS, MPS and LPS). Six PCs were obtained for HPS and MPS regions, while only five are resulted from LPS region, which have eigenvalues more than 1 with the total variance of 84.9%, 84.4%, and 77.1%, respectively. Corresponding principal components, variable loadings, and variance are explained based on Table 4.
HPS
The principal component 1 loadings with 20.8% of total variance include strong positive loadings for salinity, EC and DS; weak positive loadings include pH and NH3N; and weak negative loadings include DO. The elements of salinity, NH3N, DO, and DS, are connected with extensive pesticide usage for agricultural activities in oil palm and rubber plantations, and animal husbandry (e.g. chicken, cow, goat and pig farm) carried out within the Malacca River basin. Meanwhile, EC components are possibly connected with the erosion of riverbank due to dredging in the river. Continuously, principal component 2 loadings with total variance of 19.5% have strong positive loadings for TSS, turbidity, and Fe; moderate negative loading for temperature; and weak negative loadings for pH and NH3N. Turbidity and TSS are related with soil erosion caused by interruption from human activities and hydrologic modifications (e.g. dredging, water diversions, and channelization) (Deneshmend et al., 2011), urban development areas involving land clearing (Najar and Khan, 2012), and the erosion of road edges due to surface runoff (Juahir et al., 2011). The forest or agriculture land converted into urban areas may negatively impact the ecosystem (Ghumman, 2011) of the Malacca River basin in form of mud floods, landslides and river floods. The Fe element is possibly connected with industrial activities such as electroplating, and the NH3N is likely related to domestic waste and agricultural runoff.
Next, principal component 3 loadings with total variance of 12% indicate strong positive loadings of pH and DO; moderate positive loading for COD; and weak positive loading for NH3N. On the other hand, principal component 4 loadings with total variance of 11.5% resulted in strong positive loading for BOD; moderate positive loading for COD; weak positive loading for NH3N; and weak negative loading for Fe. The factors explained by considering the chemical components of various anthropogenic activities that constitute point source pollution from industrial effluents, domestic waste water, commercial activities and wastewater treatment plants, including agricultural runoff area that located at Kampung Batu Berendam sub-basin and in the urban area. Basically, Fe representing one of the metal groups that originating from industrial effluents. Principal component 5 loadings explained total variance of 10.7% with strong positive loading for As; weak positive loadings of NH3N and E. coli; and strong negative loading for Zn. The NH3N is suspected to be from agricultural runoff using inorganic fertilizer (Aris et al., 2013), which is able to explain the decomposition of nitrogen containing organic compounds through degradation process of organic matter (Najar and Khan, 2012), and the conditions are strongly supported by the occurrence of As used in agriculture fields to produce pesticide waste. E. coli are strongly related to municipal wastes and animal husbandry. Lastly, principal component 6 loading has total variance of 10.4% with strong positive loadings for E. coli and coliform, which strongly explains that the factors are related to municipal sewage and wastewater treatment plants (Samsudin et al., 2011) along the Malacca River, especially in urban regions.
MPS
Principal component 1 loadings explain total variance of 19.7% with strong positive loadings of salinity, EC, and DS; moderate positive loading for coliform; and weak positive loading for pH. As describe in HPS, salinity, EC and DS are subjected from agricultural runoff and animal husbandry activities. The factor to cause coliform are related to municipal wastes, oxidation ponds, and animal husbandry, where large amount of oxygen used up by the bacteria decreases the DO availability to cause anaerobic fermentation process to produce organic acids (Juahir et al., 2011). Therefore, hydrolysis process leading to acidic material to cause water pH values to decrease. Continues, principal component 2 loadings resulted total variance of 16.1% with strong positive loadings of BOD and COD; and moderate positive loadings of TSS and turbidity. TSS and turbidity elements are subjected to construction activities and urban development that carry out in Kampung Tualang sub basin and Kampung Cheng sub basin, where most activities are happen near to the stream areas and increase the sediment deposited in the river. The condition become worst when overland inputs, stream-bank erosion, and bedload sediments during storm flow (Mustapha et al., 2013) are entering the river. BOD and COD are related to anthropogenic pollution sources and are possibly come from point source pollution such as sewage treatment plants and industrial effluents. Principal component 3 loadings with total variance of 15% have strong positive loading for NH3N; moderate positive loading for temperature; weak positive loading for pH; moderate negative loadings of TSS and turbidity; and weak negative loading for Fe. As describe previously, NH3N are related to domestic waste and agricultural runoff that highly usage of fertilizer and pesticides, which possibly to increase nitrogen levels and cause decreasing to water pH values.
Principal component 4 loadings with total variance of 12.4% to result in strong positive loadings of As and Cr; weak positive loading for turbidity; and weak negative loading for Fe. Generally, Cr exists in rock and soil, which have connections with soil erosion that cause turbidity; while As is typically from pesticide used in agriculture activities. Principal component 5 loadings have total variance of 11.3% with strong positive loading for DO; weak positive loadings of pH and temperature; strong negative loading for E. coli; and weak negative loading for coliform. Meanwhile, principal component 6 loadings explain total variance of 9.9% with string positive loading for pH; moderate positive loading for Fe; and strong negative loading for Zn. The factors involved in DO element are related with high levels of dissolved organic matter consuming large amounts of oxygen (Juahir et al., 2011), including E. coli and coliform that are suspected to be from the sewage treatment plant and pesticide usage in agricultural activities within Kampung Tualang sub basin. This condition will cause the river water quality to become acidified through pH reading. On the other hand, existing Fe element in water quality are suspected from industrial effluents.
LPS
Principal component 1 loadings indicate total variance of 26.9% with strong positive loadings of salinity, EC, and DS; weak positive loading for coliform; strong negative loading for NH3N; moderate negative loadings of BOD and Fe; and weak negative loading for turbidity. As explained before, salinity, turbidity, EC, and DS are from agricultural runoff and animal husbandry activities; BOD and NH3N are discharge from wastewater treatment and domestic waste water; and Fe are form industrial effluents. Next, principal component 2 loadings show total variance of 16.2% with strong positive loading for Cr; moderate positive loadings of DO, BOD, and COD; weak positive loadings of pH and coliform; and weak negative loading for turbidity. Principal component 3 loadings resulted total variance of 12.2% with strong positive loading for TSS; moderate positive loadings of pH and temperature; weak positive loading for DO; and weak negative loadings of COD and E. coli. Several areas in Kampung Kelemak sub basin and Kampung Sungai Petai sub basin are converting from agriculture field and forest into building and residential area, which highlighted the existing of turbidity and TSS elements in water quality (except Cr that naturally exist in soil). The condition caused chemical components of anthropogenic activities from domestic and commercial wastes, which indirectly increase the coliform and E. coli elements through wastewater treatment plants. Continuously, principal component 4 loadings with total variance of 10.9% have moderate positive loadings of Fe and coliform; weak positive loadings of turbidity and DO; and strong negative loading for E. coli. Lastly, principal component 5 loadings explain total variance of 10.9% with strong positive loading for Zn; weak positive loadings of Fe and turbidity; strong negative loading for As; and weak negative loading for pH. Zn element are connected with large number of houses and buildings constructed near to river that uses metallic roofs coated with zinc, when in contact with acid rainwater and smog, these could readily mobilize zinc into the atmosphere and waterways (Juahir et al., 2011). Meanwhile, Fe element is subject to industrial effluent, the As element is related to pesticide use in agriculture activities, E. coli and coliform are connected with sewage treatment plants, and turbidity come from hydrologic modifications such as dredging, water diversions, and channelization.
CONCLUSION
HCA, DA, and PCA are applied to investigate spatial variation and potential pollutant sources of surface river water quality data for the Malacca River. HCA successfully categorized nine monitoring stations into three different cluster regions, namely Cluster 1 or LPS (comprised of S1, S2, and S3), Cluster 2 or MPS (comprised of S4, S5, and S6), and Cluster 3 or HPS (comprised of S7, S8, and S9). HPS is within Malacca Central basin, while MPS is between Alor Gajah basin and Malacca Central basin, and LPS is within the Alor Gajah basin. DA resulted in discriminating nine monitoring stations with nine discriminants assigned to 87% cases correctly using backward stepwise modes. The nine variables are turbidity, total suspended solids, pH, biochemical oxygen demand, chemical oxygen demand, E. coli, arsenic, zinc and iron. PCA indicated six components with 84.9% of total variance were extracted in HPS, while six components with 84.4% of total variance were extracted in MPS, and five components with 77.1% of total variance were extracted in LPS. Overall, the major sources of pollution come from agricultural, residential and wastewater treatment plants, domestic and commercial waste, industry, as well as animal husbandry. The present study provides useful information for local authorities in identifying sources of pollution of the examined area and effectively in proper management for land use area. Additionally, the study also helps in understanding river water quality within the basin and provides a database for future reference in developing water policies.
REFERENCES
[1] Abdi, H., Williams, L. J. (2010): Principal component analysis. – Wiley Interdisciplinary Reviews: Computational Statistics 2(4): 433-459.
[2] American Public Health Association (APHA) (2005): Standard Methods for the Examination of Water and Wastewater (21st ed). – American Water Works Association, Water Environment Federation, Washington.
[3] Ang, K. H. (2014): Potensi instrumen moral dalam melestarikan sumber air di Malaysia Kajian kes Sungai Melaka. – Geografia: Malaysian Journal of Society and Space 10(5): 44-55.
[4] Aris, A. Z., Praveena, S. M., Isa, N. M., Lim, W. Y., Juahir, H., Yusoff, M. K., Mustapha, A. (2013): Application of environmetric methods to surface water quality assessment of Langkawi Geopark (Malaysia). – Environmental Forensics 14(3): 230-239.
[5] Daneshmand, S., Huat, B. B., Moayedi, H., Ali, T. A. M. (2011): Study on water quality parameters of Linggi and Melaka rivers catchments in Malaysia. – Engineering Journal 15(4): 41-52.
[6] Department of Environment Malaysia (DOE) (2012): Malaysia Environmental Quality Report 2012. – Department of Environment, Ministry of Natural Resources and Environment, Kuala Lumpur, Malaysia.
[7] Gazzaz, N. M., Yusoff, M. K., Ramli, M. F., Aris, A. Z., Juahir, H. (2012): Characterization of spatial patterns in river water quality using chemometric pattern recognition techniques. – Marine Pollution Bulletin 64(4): 688-698.
[8] Hua, A. K. (2015a): Law Enforcement and Water Resources of the Malacca River: A Case Study of Public Perception. – International Journal of Scientific Research in Science & Technology 1(3): 111-116.
[9] Hua, A. K. (2015b): An Indication of Policy Study towards Water Resources in Malacca State: A Case Study of Malacca River, Malaysia. – International Research Journal of Social Science 4(6): 15-20.
[10] Hua, A. K., Marsuki, M. Z. (2014): Public perception towards environmental awareness. Case study: Malacca River. – International Journal of Academic Research in Environment and Geography 1(2): 53-61.
[11] Juahir, H., Zain, S. M., Yusoff, M. K., Hanidza, T. T., Armi, A. M., Toriman, M. E., Mokhtar, M. (2011): Spatial water quality assessment of Langat River Basin (Malaysia) using environmetric techniques. – Environmental Monitoring and Assessment 173(1-4): 625-641.
[12] Metro Online (April 23, 2015). Sampel air sungai dianalisis. Retrieved from
http://www.hmetro.com.my/node/45800?m=1
[13] Mustapha, A., Aris, A. Z., Juahir, H., Ramli, M. F., Kura, N. U. (2013): River water quality assessment using environmentric techniques: case study of Jakara River Basin. – Environmental Science and Pollution Research 20(8): 5630-5644.
[14] Najar, I. A., Khan, A. B. (2012): Assessment of water quality and identification of pollution sources of three lakes in Kashmir, India, using multivariate analysis. – Environmental Earth Sciences 66(8): 2367-2378.
[15] Nasbah, N. N. (January 23, 2010): Sungai Melaka Tercemar. Utusan Online. Retrieved from http://ww1.utusan.com.my/utusan/info.asp?y=2010&dt=0123&sec=Selatan&pg= ws_01.htm
[16] National Geographic Portal (2016): Water Pollution. Retrieved from
http://environment.nationalgeographic.com/environment/freshwater/pollution/
[17] Samsudin, M. S., Juahir, H., Zain, S. M., Adnan, N. H. (2011): Surface river water quality interpretation using environmetric techniques: Case study at Perlis River Basin, Malaysia. – International Journal of Environmental Protection.
[18] Singh, K.P., Basant, N., Gupta, S. (2011): Support vector machines in water quality management. – Analytical Chimca Acta 703: 152-162.
[19] Venkatramanan, S., Chung, S. Y., Lee, S. Y., Park, N. (2014): Assessment of river water quality via environmentric multivariate statistical tools and water quality index: a case study of Nakdong River basin, Korea. – Carpathian Journal of Earth Environmental Sciences 9:125-132.
[20] Voyslavov, T., Tsakovski, S., Simeonov, V. (2013): Hasse diagram technique as a tool for water quality assessment. – Analytica Chimica Acta 770: 29-35.