Abstract
Population settlements lead to fast growing urban area throughout worldwide which is required
to be monitored to maintain sustainability. Considering Remote Sensing (RS) and Geographic Information
System (GIS) techniques in Melaka River basin, Malaysia, both methods are effective to monitor and to
support decision-making in urban planning. Land Use Land Cover (LULC) was effectively used to study
the urban sprawl, apart from that Cellular Automata-Markov (CA-Markov) chain model was applied to
predict the urban scenarios for sustainable growth. The results clearly suggested that major land use changes
are built-up area and water bodies. Only vegetation classes decreased in land use. The kappa statistic for
1990, 2000, and 2010 are 0.88, 0.87, and 0.90, respectively. Meanwhile, the validation assessment of kstatistic is 0.9, which resulted the model is valid to predict the future land use. Modeling stated that land
use classes trend and pattern is transformed especially due to the urban built up area expansion. As
conclusion, RS and GIS techniques provide effective support tools in decision making for policy makers in
designing more sustainable urban habitats.
Keywords: urban sprawl, LULC, CA-Markov chain model, urbanization, sustainable urban habitat
Citation of Article:
Hua, A. K., & Gani, P. (2022). Urban Sprawl Prediction using CA-Markov Model: A Case Study of Melaka River Basin, Malaysia. Applied Ecology and Environmental Research, 157-171.
INTRODUCTION
Urbanization became a major concern worldwide especially in cities with poor planning
and management (Getu and Bhat, 2022). Urbanization process is inevitable, especially
when economic development took place and indirectly led to rapid population growth
(Dada and You, 2022). Hence, the unplanned and unorganized urbanization had caused
various problems such as pollution (Hua, 2017), deforestation (Saha et al., 2022), as well
as traffic congestion (Rahman et al., 2022). Therefore, the updated and accurate information
on land cover changes at particular regions are needed to recognize and evaluate the
changes of the surrounding environment (Xu et al., 2022). Generally, urban sprawl is
known as the extension of human populations away from the highly built up areas into rural
or suburban regions, particularly due to benefits in economic value and impact the
ecosystem (Nasr et al., 2021). Urban expansion or urban sprawl concept is implemented
when the rural areas transform into cities and town, especially involved with
industrialization activities that focus on the economic development. Although this
development provides benefits to human populations, nevertheless, these actions indirectly
lead to environmental degradation especially the damage to the farmlands and forest areas.
The population growths are considered uncontrollable and rapid migration from other
country into highly developed urban areas had ultimately caused urban sprawl. Since
population growth is expected to have correlated with urban sprawl dependently (Saha et
al., 2022), hence, the level of urbanization is suspected to increase from 20% in 2001 to 35% in 2011 (Hasan, 2011). In Melaka State, without notification by the local state
government, the rural areas transformed into unorganized urbanization due to economic
reformation and industrialization. The transformation process caused the rural areas to
convert into cities and towns, which issuing the urban sprawl as another problem in
urbanization. Nonetheless, urban sprawl comes with a cost. These costs can only be paid
by the environment, where degradation happen because of the loss of farmlands and forest
areas. Based on Baig et al. (2022), indicate remote areas and rural hilly terrains is likely to
cause migration to happen and this may turn into urban centres area, which already has
happened for a few decades and reached an alarming rate in several developed countries.
The Department of Statistics Malaysia (2006, 2011), clearly suggested the drastic increment
in population that suspected in the districts of Melaka Tengah, while Jasin districts in rural
hilly area and Alor Gajah districts in remote areas showing negative growth rate due to
massive migration occurring in the Melaka Tengah, which mainly forms the motivation of
this study. The unplanned urbanization is suspected to have resulted from high and rapid
population growth, whereby indirectly impact the pattern of land use in urban centres.
In order to design an appropriate and effective urban planning system, the evaluation
towards the land use transformation must be conducted.
Many researchers applied geospatial techniques for urban development studies, urban
management studies, as well as planning purposes (Modiri et al., 2022; Zhou et al., 2022;
Ghalehteimouri et al., 2022; Albasri et al., 2022). Cellular Automate (CA) has the ability
to work on uniform grid-based principle, thus it became popular in developed modeling of
urban growth that involves with simulating spatial processes (Modiri et al., 2022; Zhou et
al., 2022). The CA can represent any multiple structures in systems by using simple rules
from a small set of regions and state areas, and this is a benefit for urbanization studies
(Modiri et al., 2022; Zhou et al., 2022; Ghalehteimouri et al., 2022). The CA process uses
‘what-if’ scenarios, where it is used for the activities involved in planning approach (Modiri
et al., 2022; Zhou et al., 2022).
The combination of CA plus Markov Chain Model (CA-Markov) will contribute a robust
approach in the analysis of land use land cover (LULC) changes with spatial and temporal
dynamics modeling, due to their advantage of incorporating remote sensing (RS) and
geographical information system (GIS) data as well as providing more detailed information
(Maurya et al., 2022; Peng et al., 2022). Generally, the transition probabilities are controlled
among LULC classes through temporal dynamics processes in Markov model approach
(Modiri et al., 2022; Maurya et al., 2022; Peng et al., 2022), meanwhile CA have the ability
to determine the local rules whether through spatial filter of CA or transition potential maps
(Maurya et al., 2022; Peng et al., 2022). It is popular to apply the CA-Markov model into
urban environments, especially to predict the future LULC including the combination of
biophysical and socioeconomic data, as it wasrecognized by many researchers (Modiri et al.,
2022; Zhou et al., 2022; Maurya et al., 2022; Peng et al., 2022).
Several objectives had been set up in this study, namely; (i) to analyze the Melaka River basin temporal and spatial changes in the range of year 1990-2000-2010; (ii) to predict and simulate the changes in land use for the future maps of 2020 and 2030 by using techniques of CA-Markov in modeling the urban sprawl. The outcome of the presented study is expected to be highly beneficial, useful, and advantageous to urban planners, resource managers, policy makers and other experts in geography.
MATERIALS AND METHODS
Study Area and Dataset
The city developers and planners are required to design the development strategy based on sustainable approach without compromising the environment. Therefore, measuring the development trend as well as future land use patterns provide benefits and advantages to both developers and planners. This study concentrated in the Malacca River basin, Malacca State, Malaysia (Figure 1). As expected urban sprawl started in the congested city, and covered the surrounding areas of forest, lake, croplands, etc., thus assessment and measurement is required. The geographical coordinate of Malacca State lies between 2°23’16.08”N to 2°24’52.27”N latitude and 102°10’36.45”E to 102°29’17.68”E for longitude. The dataset of Landsat is obtained from USGS Earth Explorer for January 10, 1990 (Wednesday) and March 10, 2000 (Friday) using Landsat Thematic Mapper (TM), and February 02, 2010 (Tuesday) using Landsat Operational Land Imager (OLI). Only Landsat OLI were used based on multispectral of band 2, band 3 and band 4 for the combination of images in ENVI, while the other two used band 1, 2, and 3 for the image combination. All imagery data are at the path: 126 and row: 059. To avoid conflict during analysis, all images were used in original resolution of 30m. Only cloud-free spatial coverage, as well as high spectral resolution of Landsat images were acquired for all data sets used in the study.
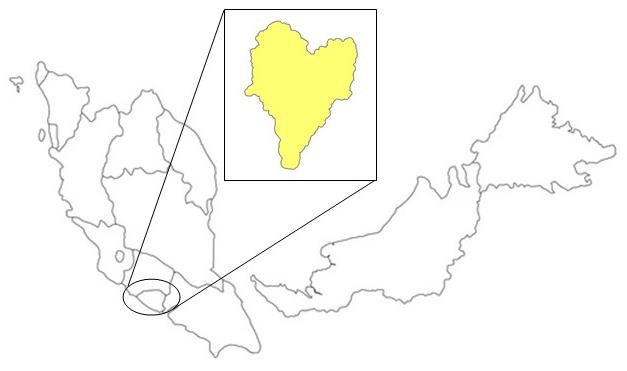
Figure 1. The study area of Malacca River basin, Malacca State, Malaysia
Data Pre-Processing and Image Classification
By incorporating the tools of ENVI, IDRISI Selva environment and GIS, the acquired data of the Melaka River basin will be processed and analysed to obtain the information regarding urban growth and environmental monitoring (Figure 2). USGS Earth Explorer is considered one of the excellent satellite databases that provide data with less cost and time, whereby all imageries are obtained from the department were used in this study. The imageries were in raw data and pre-processing was required before proceeding to analysis. Pre-processing is vital to remove the radiometric and geometric errors in the dataset, and to avoid any misinterpretation in further analysis. Then, supervised classification based on Maximum Likelihood, Minimum Distance, and Parallelepiped
Classification, were used to identify the study area which represent land used classes that being established by the user and every pixel was classified according to statistical analysis. Generally, by using simple logical rules based algorithms in Parallelepiped Classification, selection of vectors (i.e. training site) will be assigned with a specific class (e.g. built up area) and every class of training sample is statistically calculated based on the training sites before further analysis can be carried out (Modiri et al., 2022). In other words, if the specific class is digitized within the training site range, then provided specific class value will represent the pixel of band information in the classification process. These values are determined by a maximum and minimum value. As the same as Parallelepiped Classification, Maximum Likelihood classification can be explained as the vector is assigned to the specific class based on pixel, whereby the probability for each pixel equal to the specific class will result as high value (Modiri et al., 2022; Ajiboye et al., 2022). Then, the Minimum Distance classification is referred to the vector’s mean of each specific class is calculated based on the nearest distance of unknown pixel within the training site (Modiri et al., 2022; Ajiboye et al., 2022). In this study, the imagery data is performed based on delineated classes of built up area, vegetation area, and water bodies (Table 1).

Figure 2. Methodology used in the study
Table 1. Classes delineated on the basis of supervised classification

Land Use Land Cover (LULC), Cellular Automata (CA) Model, Markov Chain Model, and CA-Markov Chain Model
The land use land cover (LULC) was created using supervised classification for the year of 1990, 2000, and 2010. In order to conduct the LULC analysis, ENVI ver.4.0 was used to carry out the process. In order to detect, quantify and analyse the changes between two maps of different years, post classification changes analyses were built up area, vegetation area, and water bodies. In other words, two classified images was be interpreted and compared on a pixel basis to produce changes “-from, -to” information (Ajiboye et al., 2022). The images of 1990 and 2000, as well as 2000 and 2010 was cross-tabulated to make comparison to determine the qualitative and quantitative changes. Meanwhile, Markov chain model has the ability to continuously develop the land used based on the basic core of historical development (Albasri et al., 2022). Since this approach applies stochastic process, therefore it is often used in simulation and modeling LULC (Getu and Bhat, 2022). Then, Cellular Automata (CA) model is used the transition rules by changing the original grid cells into others character of grid cells, which also can influences the composition and configuration of the entire cells simultaneously (Modiri et al., 2022). So, both models have the capability to transform and develop the weighting spatial into similar (or different) land use classes by using contiguity filter of Transition Area file, which is important for the land use characteristic to be enhanced in later time period in a particular area (Modiri et al., 2022). In general, after complete designation of a specific class (e.g. built-up area) in 1990 and 2010 through Maximum Likelihood classification, the outcome from CA-Markov analysis will eventually recognise the designated class to perform training algorithms for estimated map of 2020 as well as 2030 (in this case, it refers to the built-up area). Hence, the probable land use classes provided will be spatially geo-referred. Therefore, CA-Markov chain model is applied due to the benefits in spatial and temporal dynamic as well as advantages in quantifying estimation for LULC dynamic modeling purposes (Modiri et al., 2022; Maurya et al., 2022). Detailed procedures for the application of LULC analysis, and CA-Markov chain model analysis can be found in the literature (Modiri et al., 2022; Maurya et al., 2022; Kabeto et al., 2022).
The urban sprawl is affected by several factors that were included in this study, and were defined by using Euclidean distance from the city, roads, and railway line. For example, when an area is close to the city and road, the probability of development might be higher; whereas if an area is farther away from the city and road, then the area might be less exposed to the development. The result provided from the change detection analysis were used to construct transition matrices based algorithm rules for the modeling purposes using IDRISI software. The change from 1990 to 2000 was calculated using CA-Markov model chain analysis to predict the 2010 of land use land cover. Afterwards, the land use land cover of 2010 was validated between the predicted and the reference map. Lastly, the process was repeated to predict on the 2020 and 2030 of land use land cover, whereby the techniques can only be done with incorporating the above mentioned parameters.
Accuracy Assessment and Validation Prediction Model
Data provided are required to determine the quality of information, and the test can only be done by using accuracy assessment technique into the imageries of 1990, 2000, and 2010. The classification on imageries can only be accurate if Kappa test is carried out, whereby all confusion matric elements including diagonal elements can be calculated (Ghalehteimouri et al., 2022). The accuracies of classification for 1990, 2000, and 2010 are 87.21%, 88.17%, and 93.35%, which have the kappa statistics of 0.88, 0.87, and 0.90, respectively. The minimum level for accuracy assessment identification of LULC categories in remote sensing data should be at least 85% (de Azevedo Lacerda et al., 2021). Meanwhile, validating the prediction model of CA-Markov is carried out between both actual image and simulated image. In other words, the model’s outcome (simulated map) will be compared to an actual (or present with the latest or updated) land use map. For instance, this study used actual map of 2010 and compared it with the simulated map of 2010. Then, comparison of both maps was validated using Kappa Index of Agreement (KIA) in IDRISI Selva, whereby the value is 0.9 (Kno = 0.913; Klocation = 0.907; KlocationStrata = 0.907; Kstandard = 0.922). Kisamba and Li (2022) stated that if the result of K-statistics is more than 0.8 can be considered accurate. Afterwards, the process was repeated for 2000 and 2010 to simulate 2020 map and forecast 2030 map.
RESULTS AND DISCUSSION
The data can be separately classified into classes by using classification algorithm. This study employed supervised method based maximum likelihood, minimum distance, and parallelepiped classification in the LULC classification, whereas unsupervised method using K-mean was used in the CA-Markov classification. These techniques are popular in classification for both supervised and unsupervised methods, especially for environmental modeling (Ghalehteimouri et al., 2022). These techniques of classification are carried out for three different years in the Melaka River basin, which is presented in Figure 3, Figure 4, and Figure 5.
Based on Figure 3 and Figure 5, interpretation through visualization indicates that the built up area clearly increased from 1990 to 2000 and these classes continued to rise in 2000 to 2010. Classifications of images are required to be accurate before the comparison of images for prediction can be carried out. As stated in accuracy assessment, the result for classification images of 1990 (87.21%), 2000 (88.17%), and 2010 (93.35%) achieved the minimum level for identification in LULC. Therefore, further analysis for comparison by using Kappa test between actual (Figure 5) and reference (Figure 6) maps (i.e. K-statistic = 0.9) were conducted with 0.8 as the minimum value of K (Kisamba and Li, 2022). Afterwards, the techniques were repeated to predict or simulate the future land use land cover of 2020 and 2030 (Figure 7 and Figure 8). The details of LULC and CA-Markov chain model are further explained below.


Change Detection and Future Growth Projection
The percentage for LULC of different classes are presented in Table 2 and Table 3. The results clearly indicate that the changes with major effect in between 1990 to 2000 was built up classes (54.5%), followed by vegetation area (60.11%), and water bodies (7.46%). The development continued to change between 2000 to 2010 in built up area for 18418.33 hectare (51.85%), and water bodies for 2367.82 hectare (6.77%). Only vegetation is suspected to have decreased in the 1990-2000 period to 14513.24 hectares (39.26%). Based on the analysis of LULC, it is obviously stated that the growing of built up area is unstoppable in the Melaka River basin. In other words, new development of urban settlement and housing demand in the state indirectly caused significant impact to the pattern of land use in the city for the twenty-years period from 1990 to 2010. Simultaneously, water bodies are assumed to have decreased from 1990 to 2000 due to the transformation of the coverage area with the demand of built up area and vegetation area. Nevertheless, water coverage is expected to increase in 2000 to 2010, which might be due to converting vegetation area of forest field into water bodies. Lastly, only vegetation area decreased continuously for twenty years, whereby this class is suspected to have transformed into built up area and/or water bodies.

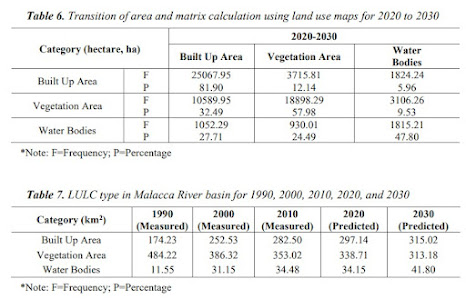
The urban sprawl for future prediction was measured using Cellular Automata (CA) Markov chain model. As highlighted in the methodology above, due to the ability of CA-Markov chain model to ‘spontaneously’ enhance the global dynamic rather than local interaction rules, makes these techniques more reliable to forecast the pattern of urban sprawl in the future prediction (Xu et al., 2022). To enable the prediction of future land use, the training process can only be repeated when the provided maps (i.e. comparison between simulated and references maps)are tested to determine the accuracy. The K-statistic value can only be archived when reach the minimum level of 0.8 as shown in the validation prediction model above, the details of particular classes are presented in Table 4. There are minor differences between simulated and actual maps, for instance built up area is +3.93 km2; vegetation area is –10.74 km2; and water bodies is +6.81 km2, respectively. Then, the predicted future land use can proceed to the next decade for 2020 and 2030. Land use classes consists of built up area with 51.17% (14784.92 hectare), vegetation area with 35.9% (4497.26 hectare), as well as water bodies with 11.59% (3872.38 hectare). For the next ten years in 2030, built up area is suspected to increase about 9.03% (3142.68 hectare), by 0.73% (184.56 hectare) for vegetation area and water bodies coverage can increase by 3.9% (1058.12 hectare) (Table 5).

Built Up Area
In the majority of cases vegetation areas and water bodies are occupied by new built up land to fulfill the demands of housing and industrial needs, as well as commercial activities. Due to high population growth human migration occurred during the past decade in the Melaka State, this circumstance enhanced the opportunity of urban sprawl in the highly developed city (Kabeto et al., 2022). The majority of highly built up areas are observed in the city center and a low-density area is assumed to have scattered form alongside with the road. Comparing Figure 3, Figure 4 and Figure 5, it clearly indicates that the development of built up area is expanding from urban land into sub-urban land in the Melaka River basin, which is suspected to extend for about 20 km towards north. Due to uncontrolled and unmanageable development, the overexploitation of natural resources by rapid urbanization activities indirectly enhanced environmental issues, especially river water pollution in the Melaka River basin. For instance, residential activities, industrial activities, as well as septic tank and sewage treatment plant activities, are suspected to contribute as main contamination in the Melaka River. Since these activities continuously increase in the number from 1990 to 2030 (Table 6 and Table 7) and suspected to grow larger scale upward towards the north side (Figure 7 and Figure 8), therefore, human activities could enhance the river pollution in percentage through anthropogenic activities (Rosli et al., 2015). So, by implementing the simulation approach, this prediction method can serve as a guide to conserve and preserve the land cover in the study area, plus along with decision-makers it can eventually improve the land use management as well as balance the artificial development and ecosystem conservation.
Vegetation Area
The land use in vegetation area is assumed to have decreased continuously for 20 years from 1990 to 2010, and land use pattern is expected to reduce in number for the next decade from 2010 to 2030 (Table 7). Based on ground observations, the majority of forest field is transform into two classes, which is agriculture and built up area. Meanwhile, agriculture land was expected to remain unchanged for several years from 2000 to 2010; but the demand to fulfill the human activities increased causing the agriculture land to transform into built up classes as stated in Table 7. For example, the area coverage is reduced about 97.9 km2 from 1990 to 2000, and continued to decrease for the next ten years by 33.3 km2, 14.31 km2, and predicted to decrease by 25.53 km2 until the year of 2030. The deforestation and continuous changes in vegetation land results in significantly high possibility of loss to others classes which will lead to decreasing trend of natural resources and environmental quality in the Melaka River basin. Most of the land resources that transformed into others classes is likely to have occurred in upstream river (or rural area). In other words, the land clearing of forest and agriculture is expected to happen in the ‘north-west’ area. Therefore, further contamination prevention in the Melaka River basin is assumed to be not possible when the built up activities is develop from the ‘south’ to the ‘north-west’ area (Figure 7 and Figure 8).
Water Coverage
As expected, the past studies show the water coverage in the study area including rivers, lakes, and reservoirs, is predicted to be reduced with time. Nevertheless, the reservoir in the Melaka River basin (e.g. Durian Tunggal Reservoir) is suspected to have increased between the years of 1990 to 2000 by 19.6 km2 (Table 7). The Durian Tunggal Reservoir is located at ‘north-east’ of the Melaka River basin. This reservoir supplies water resources to Melaka residents. The water bodies are scattered mostly surrounding the ‘north-east’ of the Melaka River basin (Figure 4). For the next ten years until 2010, the water bodies are suspected to reach a maximum coverage with an increment of 3.33 km2 (Table 7) to ‘north-west’ of Melaka River basin (Figure 5). In other words, there are several changes especially the location of land use for agriculture classes which are assumed to have shifted from the east-to-west. Therefore, this caused the shift of coordinate location for agricultural land within the basin to centralize at the ‘north-west’ area and indirectly enhanced the water resources to develop within the Melaka River basin. It is important to have water supply for agriculture activities surrounding the area. On the other hand, the majority of livestock (i.e. chicken, goat, and cow) activities are concentrated at Durian Tunggal Reservoir, which indirectly might increase the non-point source pollution in the reservoir and contaminate the Melaka River.
CONCLUSION
Incorporating between remote sensing and GIS techniques, this study demonstrates the pattern changes in urban land use system and mapping of urban sprawl. Apart from the tourism sectors as major driver of the state economy, the Melaka has the potential to develop an industrialization center in the country. The dynamic growth of population in highly developed city, whereby as stated in the study, can be used to predicted future scenario especially for making decision in the Melaka State. By applied simple rule, the CA approach that has ability to mix into spatial components, would advantages in increasing the computational efficiency. Excluding the socio-economic factors, the existing land use changes (plus geographical factors) can be calculated and the most likely to influence a land use class could be determine by applying the prediction model. CA-Markov chain model analysis clearly suggested the future land use changes in agriculture land decreased and subsequently increased in built up area of urban settlements and water bodies coverage in the basin. Based on the state development planning, since the tourism sector is concentrated in the city, therefore, industrialization is probably focuses in sub-urban areas as well as agricultural lands located at rural area. RS and GIS techniques applied in urban sprawl mapping can support the decision making especially for policy makers to design urban expansion plans with the adoption of a sustainable habitat development approach.
REFERENCES
[1] Ajiboye, J. O., Eren, Ş. G., Ugese, A. A. (2022): A Test of the Markov Prediction Model: The Case of Isparta. – Journal of Architectural Sciences and Applications 7(Özel Sayı): 114-128.
[2] Albasri, N. A. H., Al-Jawari, S. M., Al-Mosherefawi, O. J. (2022): Prediction of Urban Spatial Changes Pattern Using Markov Chain. – Civil Engineering Journal 8(4).
[3] Baig, M. F., Mustafa, M. R. U., Baig, I., Takaijudin, H. B., Zeshan, M. T. (2022): Assessment of land use land cover changes and future predictions using CA-ANN simulation for Selangor, Malaysia. – Water 14(3): 402.
[4] Daba, M. H., You, S. (2022): Quantitatively assessing the future land-use/land-cover changes and their driving factors in the upper stream of the Awash River based on the CA–markov model and their implications for water resources management. – Sustainability 14(3): 1538.
[5] de Azevedo Lacerda, L. I., da Silveira, J. A. R., Santos, C. A. G., da Silva, R. M., Silva, A. M., do Nascimento, T. V. M., Ribeiro, E. L., de Freitas, P. V. N. (2021): Urban forest loss using a GIS-based approach and instruments for integrated urban planning: A case study of João Pessoa, Brazil. – Journal of Geographical Sciences 31(10): 1529-1553.
[6] Department of Statistics Malaysia (2006): Population and Housing Census, various issues. – Putrajaya: Department of Statistics Malaysia.
[7] Department of Statistics Malaysia (2011): Population and Housing Census, various issues. – Putrajaya: Department of Statistics Malaysia.
[8] Getu, K., Bhat, H. G. (2022): Dynamic simulation of urban growth and land use change using an integrated cellular automata and Markov chain models: a case of Bahir Dar city, Ethiopia. – Arabian Journal of Geosciences 15(11): 1-26.
[9] Ghalehteimouri, K. J., Shamsoddini, A., Mousavi, M. N., Ros, F. B. C., Khedmatzadeh, A. (2022): Predicting spatial and decadal of land use and land cover change using integrated cellular automata Markov chain model based scenarios (2019–2049) Zarriné-Rūd River Basin in Iran. – Environmental Challenges 6: 100399.
[10] Hasan, A. R. (2011): Population and Housing Census of Malaysia 2010. Population Distribution by Local Authority Areas and Mukims. – Putrajaya: Department of Statistics Malaysia.
[11] Hua, A. K. (2017): Analytical and Detection Sources of Pollution Based Environmetric Techniques in Malacca River, Malaysia. – Applied Ecology and Environmental Research 15(1): 485-499.
[12] Kabeto, J., Adeba, D., Regasa, M. S., Leta, M. K. (2022): Groundwater Potential Assessment Using GIS and Remote Sensing Techniques: Case Study of West Arsi Zone, Ethiopia. – Water 14(12): 1838.
[13] Kisamba, F. C., Li, F. (2022): Analysis and modelling urban growth of Dodoma urban district in Tanzania using an integrated CA–Markov model. – GeoJournal, https://doi.org/10.1007/s10708-022-10617-4.
[14] Maurya, N. K., Rafi, S., Shamoo, S. (2022): Land use/land cover dynamics study and prediction in Jaipur city using CA-Markov model integrated with road network. – GeoJournal, https://doi.org/10.1007/s10708-022-10593-9.
[15] Modiri, M., Gholami, Y., Hosseini, S. A. (2022): Urban growth dynamics modeling through urban DNA in Tehran metropolitan region. – Annals of GIS.
[16] Nasr, M., Zenati, H., Dhieb, M. (2021): Using RS and GIS to mapping land cover of the Cap Bon (Tunisia). – In Environmental Remote Sensing and GIS in Tunisia, pp. 117-142. Springer, Cham.
[17] Peng, L, Li, C., Yang, J., Li, Z., Wang, H. (2022): Multi-source remote sensing monitoring and prediction of urban expansion in typical coastal zone: a case study of Qingdao. – Bulletin of Surveying and Mapping 1: 105.
[18] Rahman, M. M., Najaf, P., Fields, M. G., Thill, J. C. (2022): Traffic congestion and its urban scale factors: Empirical evidence from American urban areas. – International Journal of Sustainable Transportation 16(5): 406-421.
[19] Rosli, S. N., Aris, A. Z., Majid, N. M. (2015): Spatial variation assessment of Malacca river water quality using multivariate statistical analysis. – Malaysian Applied Biology 44(1): 13-18.
[20] Saha, P., Mitra, R., Chakraborty, K., Roy, M. (2022): Application of multi-layer perceptron neural network Markov Chain model for LULC change detection in the Sub-Himalayan North Bengal. – Remote Sensing Applications: Society and Environment 26: 100730.
[21] Xu, L., Liu, X., Tong, D., Liu, Z., Yin, L., Zheng, W. (2022): Forecasting Urban Land Use Change Based on Cellular Automata and the PLUS Model. – Land 11(5): 652.
[22] Zhou, Y., Wu, T., Wang, Y. (2022): Urban expansion simulation and development-oriented zoning of rapidly urbanising areas: A case study of Hangzhou. – Science of the Total Environment 807: 150813.