Abstract
Modeling the effects of past and current land use composition on surface water quality of the Malacca River watershed provides valuable information for environmental and land planning. The Land use land cover (LULC) spatio-temporal changes in watershed are classified as non-industrial area, industrial area, vegetation area, open space area, water bodies, as well as farming area. This is compared with the future spatial pattern simulated using CA-Markov model to evaluate qualitative and quantitative changes of LULC over time (between 2001, 2008, 2015, and 2029). This analysis consisted of the entire Malacca River watershed area. Changes may provide information on determinant of river water quality in future. Based on LULC monitoring and future simulation approach, the results may be used in an early warning system by demonstrating trend and consequences of changes in watershed. Continuous downward trends for vegetation area, open space area, and water bodies are due to expansion in non-industrial area, industrial area, and farming areas that increase contamination in the Malacca River. The findings demonstrate the need for more regulation in land use policy design, planning, and development for the protection of river water quality.
Keywords: land use land cover changes, CA-Markov model, land-sat, quantitative and qualitative simulation
Citation of Article:
Hua, A. K. (2017). Application of Ca-Markov model and land use/land cover changes in Malacca River Watershed, Malaysia. Applied Ecology and Environmental Research, 15(4), 605-622.
INTRODUCTION
Anthropogenic activities negatively affect the conditions of the world’s water. Various studies have estimated that half of the world’s water quality has decreased due to human activities (Aris et al., 2013; Najar and Khan, 2012), and this condition has continuously worsened until today (Hua, 2017; Rosli et al., 2015). According to Hua et al. (2016), the main characteristic to cause contamination and detected as pollutant sources are residential, industrial, and agricultural activities. This matter is confidently supported by a majority of researchers (Aris et al., 2013; Hua, 2017; Hua et al., 2016; Rosli et al., 2015; Wan et al., 2014). Human alteration of cities engineered toward the land use land cover (LULC) change drastically results in negative impact on water quality, especially in rivers (Wan et al., 2014; Yang et al., 2012). Based on the evidence, contaminated rivers could threaten aquatic animal, reduce the availability of quality water. This will affect the flora and fauna, as well as affecting the climate at a regional scale (Carey and Fulweiler, 2012; Wan et al., 2014). Hence, it has become essential to obtain an understanding of how recent trajectories of land use will manifest in the future (Parsa et al., 2016; Subedi et al., 2013).
LULC change models are usually applied to detect location of the changes occurred or will potentially occur (Halmy et al., 2015; Yagoub and Al Bizreh, 2014). By determining the factors of the changes, the models benefit through providing probabilistic prediction of possible changes may occur (Halmy et al., 2015). Technically, change analysis is carried out using historical land use data in which the past land transformations and transitions were assessed. The transition trend is incorporated with environmental variables to provide an estimate of future scenarios (Behera et al., 2012; Yagoub and Al Bizreh, 2014). Prediction of LULC changes is important to understand and highlight the potential modifications and alterations that might be happen to the landscape in the near future. Typically, changes occur due to increasing population, distance to roads or other facilities, type of the soil, environmental issues, and so on. LULC models are usually used to assess the cumulative impact of land use changes and develop the future scenarios (Behera et al., 2012; Halmy et al., 2015), which is important in providing support and help to land use planners, resource managers, and conservation practitioners in making decisions (Halmy et al., 2015; Memarian, et al., 2013; Parsa et al., 2016). Simultaneously, prediction LULC changes model provide advantages in different applications, such as urban planning through modeling rural development and urban growth (Arsanjani et al., 2013); selecting conservation priority areas and setting alternative conservation measures (Subedi et al., 2013); studying dynamics of shifting cultivation (Halmy et al., 2015); as well as simulating the land use range dynamics under different watershed area (Behera et al., 2012; Memarian, et al., 2013).
Markov chain analysis works on the assumptions of physics in which the probability of a system being a certain state at certain time can be determined if the earlier time state is known (Arsanjani et al., 2013; Behera et al., 2012; Halmy et al., 2015). In other words, Markov chain analysis uses statistical spatially dependent land use data required by logistic regression (Arsanjani et al., 2013). This method is based on developing a transition probability matrix of land use change between two different dates derived from observation, which will be used to provide estimations of the probability that each pixel of certain LULC classes will be transformed to another class or remain in the same class (Yagoub and Al Bizreh, 2014). Nevertheless, Markov chain analysis has several issues as the methods only provide short-term projection (Sinha and Kumar, 2013) and are not spatially explicit (Halmy et al., 2015), as it does not provide spatial distribution of the changes that might occur to understand more about the potential impact of the projected changes. These issues can be overcome through suggestion of integrated modeling approaches with other different dynamic and empirical methods considered suitable for modeling land use changes processes (Halmy et al., 2015; Sinha and Kumar, 2013).
The Markov chain model can be integrated with the cellular automata model (or CA Markov model), and these models have been widely used in different scale especially involve with modeling and predicting the land use change (Arsanjani et al., 2013; Subedi et al., 2013). The CA-Markov model is applied in this for the advantages of the combination of the stochastic aspatial Markov techniques with the stochastic spatial cellular automata method (Arsanjani et al., 2013). These include the prediction of two-way transitions among the availability of LULC classes rather than the Geomod technique that only concentrates on prediction of one way loss or gain in one classes (Halmy et al., 2015). Hence, transition based models are the integration between aspatial Markov model with spatial cellular automata model to performed the regression-based models in predicting the land use change. This study has been carried out to provide information on the presence of LULC patterns in the Malacca River watershed and aims to analyze the changes of landscape trend pattern using the past LULC, the presented LULC, and future LULC using simulation modeling for the Malacca River watershed.
MATERIALS AND METHODS
Study Area
Malacca state is located in southwest Peninsular Malaysia at 2°23’16.08”N to 2°24’52.27”N latitude and 102°10’36.45”E to 102°29’17.68”E for longitude. Malacca state has a catchment area of approximately 670 km2 and contains an 80 km length of Malacca River flowing through Alor Gajah and Malacca Central (Figure 1). Malacca state also has a reservoir located between Alor Gajah and Malacca Central called the Durian Tunggal Reservoir; with a catchment of 20 km2 . This reservoir supplies water to Malacca residents. Increasing local population has led to increasing public facilities such as transport, healthcare, accommodation, sewage and water supply services (Hua, 2017; Rosli et al., 2015). Due to drastic population growth, rapid urban development in Malacca state also increased; especially demanding from the land use perspective. A majority of residential activities are centralized in the city, which extends about 10 km to the west, the east, as well as the north for 20 km. Land use changes is continuously develop until today. Indirectly, these actions have contributed to economic growth and social relationships, including impacting the environmental quality of the water in the Malacca River.

Data Collection
Remotely sensed data have been widely used as a very cost effective mean to obtain geo-referred data and maps for evaluation and monitoring LULC. Three LULC data sets of the Malacca River watershed were obtain from USGS Earth Explorer dated 2001, 2008, and 2015 and used in this study. These three data sets are considered suitable with cloud free spatial coverage and relatively high spatial and spectral resolution of satellite images. Remote sensing images of Landsat satellites were selected for the investigation of long term variations in LULC types in the study area (Table 1). After the limitations and constraints regarding of the data were taken into account, a 14-years period or time-span was found appropriate for monitoring and evaluation of LULC dynamic. The steps of the research study are shown in Figure 2.

Data Pre-Processing and Image Classification
Preprocessing of satellite images is essential and aims at the unique goal of establishing a more direct linkage between data and the biophysical phenomena it represents (Parsa et al., 2016). Pre-processing is accomplished using ArcGIS version 10.0 for geo-referencing, mosaicking and sub setting of the image for the Area of Interest (AOI). Landsat 8 image underwent spatial sharpening using the panchromatic bands, which resulted in a 15m resolution. Meanwhile, Landsat 5 TM and Landsat 7 ETM+ images for 2001 and 2008 were in original 30m resolution. Further image processing analysis was carried out using ENVI 4.0. The image was displayed in natural color composite using a band combination of 3, 2, 1 for Landsat 5 TM and 4, 3, 2 for Landsat 8. Maximum Likelihood supervised classification was performed using several selected regions, and Regions of Interest (ROI) were based on delineated classes of vegetation area, industrial and non-industrial area, water, open space area and farming area (Table 2).

Accuracy assessments for the 2001, 2008, and 2015 images were carried out to determine the quality of information provided from the data. If the data are to be used for change detection analysis, it is important to conduct accuracy assessment for individual classification (Behera et al., 2012). Kappa tests are used to measuring the accuracy of classification as the test is able to account all elements in confusion matrix including diagonal elements (Halmy et al., 2015). The Kappa test is a measure between predefined producer rating and user assigned rating, which can be expressed in the formula as:

where P(A) is the number of time the k raters agree, and P(E) is the number of time the k raters are expected to agree only by chance (El-Kawy et al., 2011; Pontius and Millones, 2011). Meanwhile, user accuracy can be defined as the probability of a pixel on the image actually representing a class on the ground. Producer’s accuracy indicates the probability a pixel being correctly classified and is mainly used to determine how well an area can be classified (Pontius and Millones, 2011). As described earlier, the six categories of classes which include vegetation area, non-industrial area, industrial area, water bodies, open space area, and farming area, that have been delineated should have a minimum of 50 points for each considered category to increase the percentage of accuracy assessment (El-Kawy et al., 2011). Therefore, the accuracies of classification for 2001, 2008 and 2015 are 89.51%, 88.49%, and 92.21%, which have kappa statistics of 0.87, 0.85 and 0.90 respectively. According to Weng (2010), the minimum level for accuracy assessment in identification of LULC categories in remote sensing data should be at least 85%. Afterwards, the data is exported into an ASCII text file to enable for further analysis in ArcGIS version 10.
In performing LULC change detection, the post-classification detection method is applied in the IDRISI Selva environment v.17, which involves two classified images to make a comparison to produce change information on a pixel basis. In other words, the interpretation between two image provide will provide changes “-from, -to” information. Classified images from two different data sets are compared using cross-tabulation in determining qualitative and quantitative aspects of changes for periods from 2001 to 2015. The magnitude of change and percentage of changes can be expressed in a simple formula as follows:

where K is magnitude of changes, A is percentage of changes, F is first data, and I is reference data (Mahmud and Achide, 2012). Additional, prediction or estimation of LULC changes for 2029 will also use IDRISI Selva environment v.17. This research study uses LULC techniques in remote sensing to determine differences and define the percentage of land use changes within that time, as well as estimation for the next 14 years.
Markov Chain Model Analysis
The Markov chain model was presented by a Russian mathematician named Andrei A. Markov in 1970. This model was first used by Burnham for land use modeling (Mishra and Rai, 2016; Parsa et al., 2016). Markov chains are stochastic processes (Halmy et al., 2015; Subedi et al., 2013) and the matrices to show changes between land use categories (based on the basic core principle of continuation of historical development) (Koomen and Borsboom-van Beurden, 2011) and are often used in modeling and simulation changes and trends of LULC (Halmy et al., 2015; Mishra and Rai, 2016; Parsa et al., 2016). The homogeneous Markov model for prediction of land use changes can be mathematically presented as follows (Subedi et al., 2013):

Cellular Automata (CA) was developed by Ulam in 1940 (Mishra and Rai, 2016; Parsa et al., 2016) for application in land use changes conceptually. Afterwards, CA was used by Tobler in geographical modeling (Arsanjani et al., 2013), and widely used in spatial model (Halmy et al., 2015) for forecasting future land use. CA consists of a grid or a raster space, a set of states characterizing the grid cells and a definition for the neighborhood arrangement of cells, a set of transition rules determine the state transitions for each of the cells as a function of the position of neighboring cells and a sequence of discrete time steps then updates composition and configuration of all the cell simultaneously (Arsanjani et al., 2013; Mishra and Rai, 2016; Parsa et al., 2016). The basic principle of CA is that the land use changes for any location (cells) can be explained by the current state and changes in neighboring cells (Koomen and Borsboom-van Beurden, 2011).
CA-Markov Chain Model
The ‘Cellular Automata’ and ‘Markov Chain’ models are considered to be advantageous for modeling land use changes (Mishra and Rai, 2016; Parsa et al., 2016). The issues involved when a Markov chain model lacks spatially referred output and transition probabilities may be accurate on a categorical basis, there are no specifications on spatial distribution of each land use category occurrence (Arsanjani et al., 2013). Cellular automata added into a Markov model lead to probable spatial transitions occurring in particular area over a period time (Subedi et al., 2013). In other words, the quantity of changes from the Markov Chain model then are made geo-referred and spatial through cellular automata (Mishra and Rai, 2016). The CA-Markov model uses Markov Chain analysis outputs, particularly the Transition Area file, to apply a contiguity filter to enable the development of other land use characteristics from time two into a later time period (Parsa et al., 2016). The CA is able to develop a weighting spatial on the particular areas which have approximately the same to the existing land use based on classes, and it is not random (Subedi et al., 2013). Hence, the CA-Markov model is considered a robust approach because of the quantitative estimation and the spatial and temporal dynamic it has for modeling the LULC dynamic (Arsanjani et al., 2013; Mishra and Rai, 2016; Parsa et al., 2016; Subedi et al., 2013). GIS and remote sensing is easy to fir with CA-Markov model to facilitate tasks and reduce the cost and time needed (Mishra and Rai, 2016; Parsa et al., 2016). In this study, IDRISI Selva v.17 is used to predict the future LULC of study area on CA-Markov model. In other words, CA-Markov will use the 2001 and 2008 maps to produce a simulated 2015 map, which is important to validate with actual LULC of 2015 map through KIA (Kappa Agreement of Index) approach (Mishra and Rai, 2016; Parsa et al., 2016). Afterwards, the techniques are repeated using the 2008 and 2015 map to produce a simulated 2029 map.
Validating LULC Prediction Model
In order to avoid miscalculation, investigation between actual image and simulated image will be carried out, where the model’s output was compared to a present or actual land use map. Comparing the predicted LULC map representing the 2015 LULC with actual LULC (map of 2015) was based on Kappa Index of Agreement (KIA) approach, which is widely used in validate LULC change predictions (Mishra and Rai, 2016; Parsa et al., 2016; Subedi et al., 2013). An additional map of Landsat TM 2008 will be used to help in validating process, before CA-Markov model can be applied for estimation of the next 14 years. The validation module is available in IDRISI Selva environment v.17 for this purpose.
RESULTS
LULC maps assessment
The images show that the LULC maps significantly change from one class to another class (Figure 3). Based on general observation, drastic changes can be detected on water bodies between 2001 to 2015 [Figure 3 (a) and (c)], as most of these classes change from blue into green color and the area becomes smaller-scale. In other words, the water bodies coverage is suspected to transform into vegetation area, which refers as agriculture activities that carried out within the reservoir. Meanwhile, the non-industrial area is suspected to increase by a big margin, especially in the urban area. Majority classes that converted into non-industrial area are vegetation area and open space area. Only the small scale is subjected to the changes that occur in sub-urban and rural areas. At the same time, small scale shows an increase in industrial area, which is likely to be converted from open space area.
Continuously, the LULC map changes from 2015 to 2029 indicate that majority activities are converted from vegetation area into non-industrial and industrial area. At the same time, several areas on open space classes are also having converted into non-industrial area. The non-industrial area having big margin in conversion of development, followed by industrial area that have partially big scale in increasing the area for development purposes. Most of the development is occur in sub-urban and rural area. This rapid development shows positive impact towards the urbanization and modernization in Malacca state.
Validating LULC prediction model
In order to validate the LULC prediction given by the CA-Markov model, the simulated
land use areas were used to compare the actual present land use areas. The LULC for 2015 was predicted through the model to produce simulated map and make comparison with the
actual LULC map of 2015. Comparison of simulated and classified map for the year 2015
can be shown in Table 3. Visual analysis shows that simulated LULC map and actual map
have relatively close resemblances.
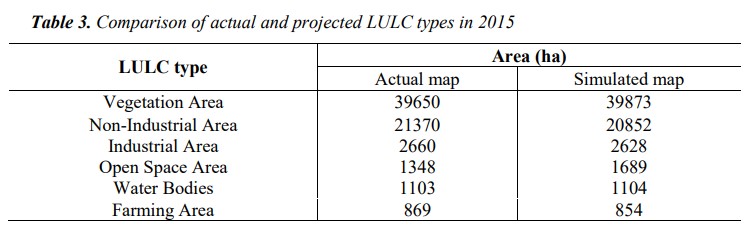

Table 3 indicates that industrial area, water bodies, and farming area have the best
agreement. The simulated areas are 2628 ha, 1104 ha and 854 ha, while the actual area
is 2660 ha, 1103 ha and 869 ha respectively. The simulated LULC map shows that nonindustrial area, industrial area, and farming area are underestimated; while vegetation
area, open space area, and water bodies are overestimated. Hence, the detailed statistical
analysis based on the Kappa coefficient is used to measure the overall agreement of
matrix, the ratio diagonal values summation versus total number of pixel counts within
matrix, and the non-diagonal elements will be the best approach to assess the model
accuracy (Arsanjani et al., 2013).
A kappa value of 0 illustrates the agreement between actual and reference map (equals
chance agreement), the upper and lower limit of kappa is +1.00 (its occur when the is total
agreement) and -1.00 (its happen when agreement is less chance (Arsanjani et al., 2013).
The accuracy assessment process was done using VALIDATE module in IDRISI Selva
environment v.17. The results indicate K values (Kno = 0.878; Klocation = 0.863;
KlocationStrata = 0.863; Kstandard = 0.843) above 0.8 showing satisfactory level of
accuracy. According to Viera and Garrett (2005), if the results are greater than 0.8 for each
kappa index agreement, then the K statistics are considered accurate. Therefore, CAMarkov modeling is suitable for accurate prediction of future LULCs. This may be useful
in this study for environmental management decision making and planning which involve
the water quality of Malacca River.
LULC change detection
LULC change can be described in Table 4, where the activities carry out in Malacca
River basin can be classes into vegetation area, non-industrial area, industrial area, open
space area, water bodies, and farming area. According to LULC changes between 2001 to
2008 (Table 5), vegetation area and open space area are likely to be transform into nonindustrial area (with 22.36% and 24.31%) and industrial area (with 3.13% and 2.04%)
respectively. Water bodies is suspected to be decline about 66.57% and change into
vegetation area, where this situation happen due to the sufficient water supply and fertile
soil leads to the agriculture activities could be carried out. Based on the Figure 3 (a) and
(b), the agriculture activities are likely to occur in north-east area especially surrounding the
reservoir. Meanwhile, open space area is also subjected to transform into vegetation area
with 7.07%. Only a small percentage is detected to convert from vegetation area into
farming area with 0.05%, indicating that a minority of animal husbandry is carried out on a
small scale and mostly being conducted by local residents.


